|
|
Stationary |
[FrontPage Include Component] |
|
|
|
|
|
|||||
|
NAVIGATOR: Back - Home > Adi > Products > Apas > Comparison : |
|||||
|
|
|||||
| |||||||||||||||||||
|
Stationary
Categories
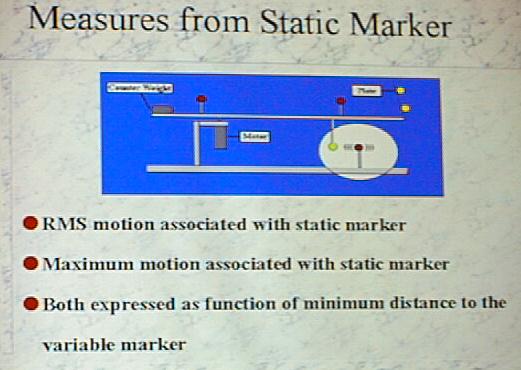
| Stationary testThis important test measures the influence of a moving marker on a static marker, which remains immobile, or on another marker. Theoretically, movement analysis should minimize noise created by movements which do not actually exist. Slide 19 illustrates the moving markers relative to the stationary marker.
The stationary test measured the ability of the system to maintain static measurements when a moving marker passed in the vicinity of a stationary marker. With most marker-based systems, this is a major problem which necessitates human intervention to manually correct the problem. The point is, a stationary marker should not move.
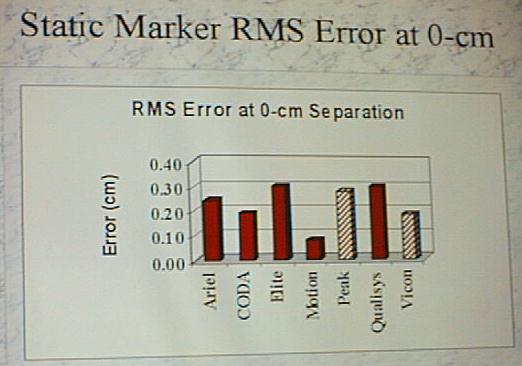
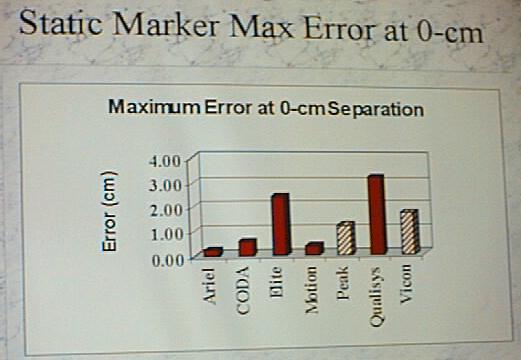
***Markers crossed, only subset of data which was properly identified was use for analysis. Table 4. 0-cm test results Table 4 illustrates the data for the 0-cm separation. As can be seen, APAS performed the best with an average error amounting to 1.4 mm in a 3000 mm volume. This result was the lowest of all systems. The maximum error amounted to 2.4 mm, again the lowest of all systems. For both Peak and Vicon, only a subset of the data points were used since the markers crossed and switched.
Slide 20. RMS Error at 0-cm separation. Slide 20 illustrates the error for the 0-cm separation. Motion Analysis performed the best and APAS was second. Peak and Vicon were unable to keep the markers on track so there was switching of the markers. However, the investigator of this research chose not to include these errors in the statistical analysis. If these measurements had been included in the statistics, the error would be much larger!!!
Table 5: 2-cm separation test results In the 2 cm separation test, Qualisys had the smallest total error. Vicon and Peak again had a problem with switching of the points between the stationary and the moving targets. However, in spite of this crossing problem, they were given a score. One should keep in mind that the error is only 2 mm in 3M volume. This is approximately a .06 percent error. As can be seen in Slide 21,APAS outperformed all of the other systems. As was seen previously with other conditions, both Peak and Vicon demonstrated problems with a switching of the targets although the largest error was observed in the Qualisys system.
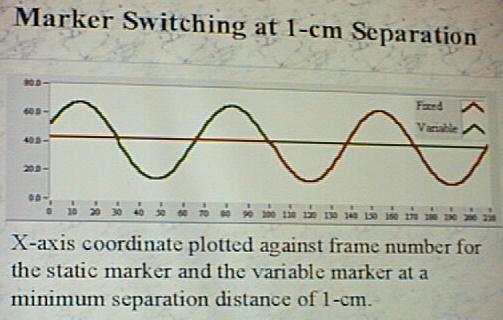
Slide 22 shows the large error the Peak and Vicon produced in tracing markers. This means that when markers approach approximately 1 cm distance from each other, neither the Peak nor the Vicon system can detect the difference between the markers. APAS was able to do a perfect job. Markers were never switched regardless of the distance between them. Even at a 0-cm separation, which means no separation, APAS was able to detect the markers. |
|
|