|
|
Quick Guide |
[FrontPage Include Component] |
|
|
|
|
|
|||||
|
NAVIGATOR: Back - Home > Adi > Services > Support > Tutorials > Gait : |
|||||
|
|
|||||
| |||||||||||||||||||
|
Quick Guide
Categories
|
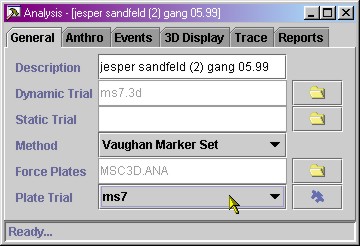
APAS/Gait Quick Guide[ Tutorial | Quick Guide | Lab Setup | Virtual Lab ] Make sure you have the latest APAS/Gait version 1.04 - Revision 2004.10.21 or later. The version is shown in the title bar of the main window. The latest version can always be downloaded from here. 1. Select data files containing kinematic and force plate dataIf your lab contains force plates, you may want to check your force plate setup here. [ms7.3d] [ms7.cf] [MSC3D.ANA] [More data files]
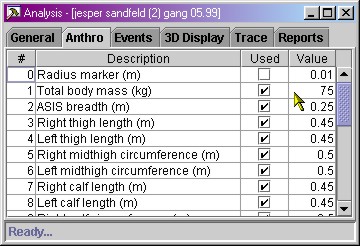
2. Anthro SettingsFor accurate results you should enter the correct Anthro-settings. The numbers you see on your screen are only default settings. They should be changed to match the individual's anthro measurements. APAS/Gait will remember them in a *.gait file, so you only need to enter these settings once. Here's our ms7.gait file if you would like to use it. These are the settings to enter for all msX files: [0.01; 69; 0.225; 0.41; 0.415; 0.5; 0.505; 0.4; 0.4; 0.38; 0.38; 0.091; 0.091; 0.262; 0.259; 0.069; 0.069; 0.07; 0.07; 0.089; 0.091; rest not used]. So enter 69 (kg) for total body mass, etc. etc.
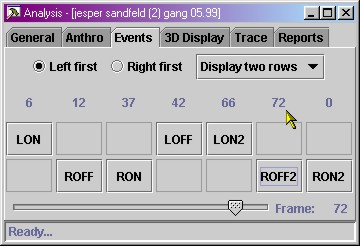
Do it. Watch how whenever you change a setting that is "Used" by the underlying model, everything will be recalculated and updated (3D animation, reports, charts, data browser). This is good for exploring the influence of these parameters on the final results. Progress of calculation (it takes a few 100 milliseconds) is shown in the little status bar at the bottom of the Analysis window (where it says Ready...). 3. Gait EventsYou should identify the gait events. They will also be remembered in the *.gait file, so you need to enter these only once. You could optionally enable the traces on the ankles to help you determine which are the correct gait events. The gait events are important when showing charts or reports for Gait Cycle or Stance Phase and for calculation of the summary at the top of the report. So, for the file ms7.3d the gait settings should be similar to below:
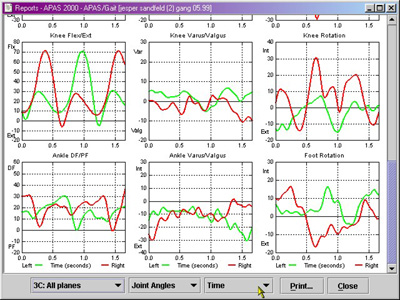
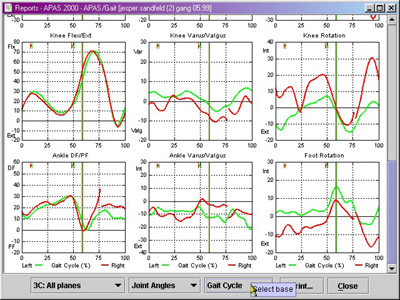
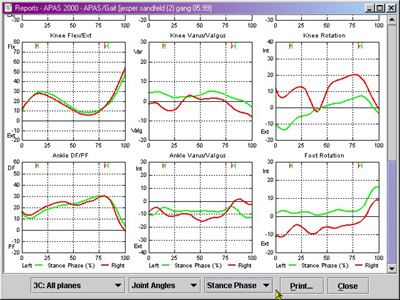
After you have entered these settings, watch what happens if you create a report and then change the time base at the bottom of the screen. The screen shots here are for kinematics, but you can also choose the kinetics parameter of interest at the bottom of the screen. Or change the layout from 3 columns to 1 column.
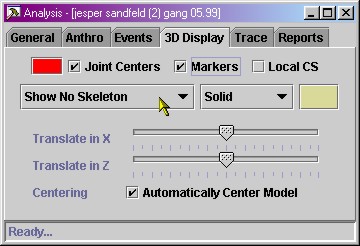
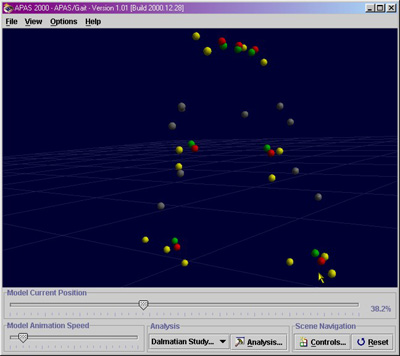
4. 3D DisplayChoose "Markers" and "Show No Skeleton". This may make the 3D animation smoother on a notebook and you can see where the joint centers are relative to the markers. If you change the anthro-settings you can actually see what happens. For example change knee width from 10 cm to 15 cm and see the results immediately everywhere in the application. Also if you have any reports open when doing this everything will be updated automatically!!
5. Comparing marker setsThis is a different demo. It show the influence of different marker sets.
You can now see (in the 3D window) exactly the difference caused by the different marker sets on the same data. The joint centers will be in a slightly different place because the underlying model is different. This will of course influence everything, joint angles, and kinetics. Therefore the reports should be slightly different for the different marker sets.
Note that APAS/Gait is written in stereo vision. If you install a stereo-enabled graphics card and LCD-shutter glasses, you will see the 3D in 3D stereo, adding depth!!!!!!!
|
|
|